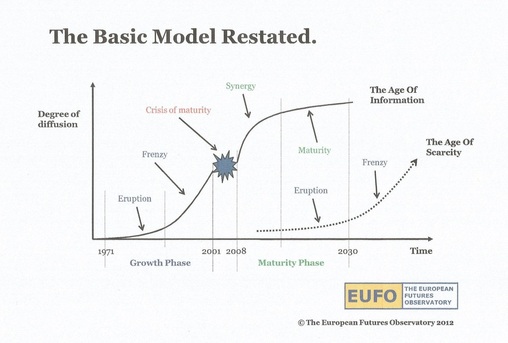
 The Basic Perez Model restated to include a projected temporal dimension.
 For a number of years a puzzle has been occupying commentators on the British economy. On the one hand, output fell very sharply in the initial phases of the recession in 2008, but on the other hand, employment was kept buoyant. The Economist published a couple of charts at the time (2013) which highlighted this phenomena [1]. The key explanation at the time was that firms were hoarding labour as a way of being prepared for the upturn. In this way, output per worker – a crude measure of labour productivity – would fall.
Since then, we have seen a recovery in the levels of output. However, as output has risen, so have the numbers in employment, suggesting that output per worker has not improved in the early phases of the recovery. It might be that we are simply seeing a time lag in the adjustment process within the economy. Some would point to the are growing numbers of self employed workers, who normally work longer hours for smaller remuneration than their employed counterparts [2]. It certainly goes some way to explaining why it is that, despite a recovery in the wider economy, real wages have fallen for five years. And yet it also fails to explain why it is that labour productivity - the key to increasing real wages – seems so resistant to improvement. Perhaps there is something else going on? How would this issue look from a long term perspective?
Our views on the long term perspective of the economy are very influenced by the work of Carlota Perez. We take the view that we currently occupy a position where the Maturity Phase of the Fifth Wave (the ICT wave) has just begun, and where the Pre-Eruption Stage of the Sixth Wave is starting to emerge [3], which can be seen in the accompanying chart that describes the architecture of the long waves. Elsewhere, we have argued that the Sixth Wave may well come to be known as ‘The Green Wave’ [4]. Much is made of the interior architecture of the waves, but it is worth giving a little thought to the transition from one wave to another. If we were to use the Three Horizons Model to describe this [5], then we could stylise The Fifth Wave (W5) as Horizon 1 (H1), the Sixth Wave (W6) as Horizon 3 (H3), and the transition between the two waves as Horizon 2 (H2). Perhaps a study of H2 might give us some clues about the productivity puzzle from a longer term perspective?
In considering this longer term perspective, we need to give some thought about what the model means. The relationship, as described in a graphical form, shows the ‘degree of diffusion’ over the time span of a technological paradigm - a bundle of related technologies that come to define that paradigm (e.g. the ‘Information Age’). This degree of diffusion warrants further thought. From a slightly different perspective, we could stylise this as the accumulation of change over time related to that particular surge in technology. The greater the degree of diffusion of a technological paradigm over time, the greater the degree of change that is accumulated. If we accept this view of the basic model, then a number of interesting conclusions emerge.
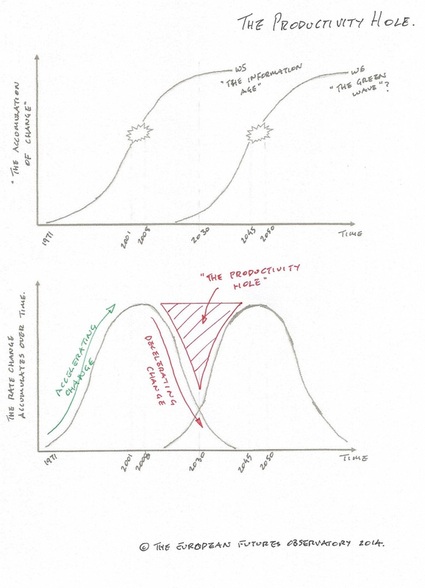
 The Productivity Hole - How the Perez surges, the pace of change, and productivity fit together.
 One thing that the model suggests is that change does not accumulate evenly over time. There are periods when the accumulation of change occurs rapidly, whilst at other times change accumulates less rapidly. We conceive of this as the pace of change. Within the context of the model, a graphical representation of the pace of change, and its relationship with the degree of accumulated change is shown on the accompanying graph. If this view is correct, then it suggests that the pace of change peaked just before the recession, that we are entering a phase where the pace of change associated with W5 is decelerating, and the pace of change associated with W6 has yet to accelerate to the point where it has a measurable impact. In terms of the three horizons model, we can say that the pace of change will diminish in H2 before picking up again.
This has a number of significant consequences. If we accept that there is a strong positive linkage between the pace of change and innovation, and that innovation drives investment, which fuels productivity gains, then the model suggests that a feature of H2 - the transition from one technological paradigm to another - will be a falling away in productivity gains. In other words, a productivity hole emerges. This has implications for both aggregate demand through a period of sluggish investment performance, and for aggregate supply through a period of restrained productivity growth. We have argued elsewhere that this could well dominate the experience of the rest of this decade, and that we would expect to come out of this phase in the 2020s, as the pace of change associated with W6 starts to gather momentum [6].
What we cannot be sure about is how long this process will take. Much will depend upon the policy environment created by governments. If the policy of austerity continues to be the dominant view of policy-makers, then we can expect the process to take longer than we could otherwise expect if a policy of fiscal expansion were to be followed. It is likely that the deficiencies in aggregate demand will constrain the investment climate as businesses hold back on creating new productive capacity in the face of uncertain prospects of being able to sell the produce of that increased capacity. Continued austerity is almost certain to make further QE likely in the years to come, but this monetary expansion is likely to continue to swell the asset prices of unproductive capital (the stock markets and property values) rather than accommodate the expansion of productive capital. An important part of the Perez model that is missing is an asset switching model between productive and unproductive capital.
Perhaps we might take a turn in this direction in the future?
Stephen Aguilar-Millan
© The European Futures Observatory 2014
References:
[1] http://www.economist.com/news/britain/21570692-dive-britains-productivity-puzzle-uncovers-serious-risk-economy-job-rich
[2] http://www.independent.co.uk/news/uk/collapse-in-pay-lies-behind--britains-return-to-work-9324388.html
[3] Our article can be found here: http://www.eufo.org/uploads/1/4/4/4/14444650/surfing_the_sixth_wave.pdf It also contains a more detailed description of the mechanics of the Perez long waves, along with supporting references.
[4] http://www.eufo.org/uploads/1/4/4/4/14444650/science_omega_the_green_wave.pdf
[5] See our review on the Three Horizons Model http://www.eufo.org/the-futurist-blog/three-horizons-the-patterning-of-hope
[6] http://www.eufo.org/uploads/1/4/4/4/14444650/world_future_review-2014-aguilar-millan.pdf
 RSS Feed


